Based on everything we have done in Part 3 of the series, we have come to the final configurations, which is to build subject area and execution plan:
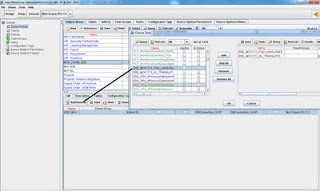
The subject area name is MCK_Forklift_SDE and the task being added to it is
SDE_MCK1213_FND_LANGUAGES. I had added another task to this subject area previously, therefore we have 2 task entries here in this example. Don't be surprised.
Very important, after manually adding the tasks to this subject area, don't forget to assemble this subject in order for all the changes to be generated and saved:
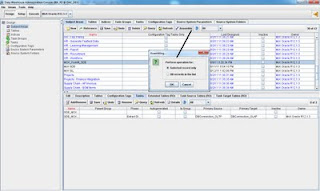
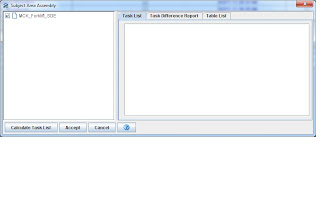
Now once the subject area is created, let's move on to creating an execution plan. The execution plan is what will be scheduled or run manually on demand. One execution plan can have many subject areas, which can also have many tasks and task groups. In order words, one execution plan can have a bundle of tables, tasks, subject areas, parameters and other dependencies. It can get fairly complex depending on the requirement, but for the purpose of this article, let's stick to the simple and basic ones as shown below.
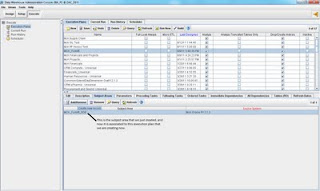
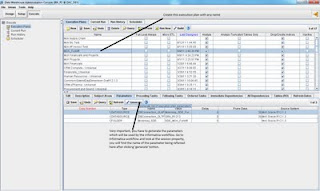
Remember the parameters defined in the session properties? The parameter file won't be generated until we generate parameters in the execution plan. The 'generate parameter' step is important. Make sure the value of each parameter matches the DB connection name in Informatica and the folder name value matches the name of the physical folder name created earlier:
After that is done, let's 'build' the execution plan:
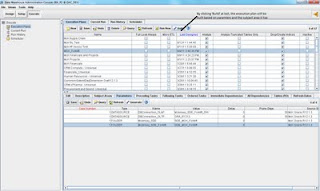
This 'build' process will automatically add the tasks to the execution plan based on the subject area the execution plan has, the following window will pop up during the build process to indicate what will be 'built' to this execution plan:
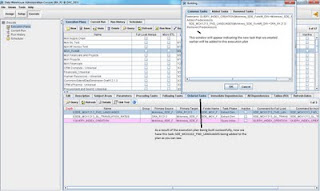
After that is done as we can see from the below screenshot that the execution plan is built with 2 'ordered tasks' underneath. That's exactly what I expected. Now the next thing is to simply run this execution plan to see if it works:
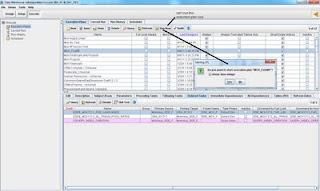
Go to the 'current run' tab to see the status of this task:
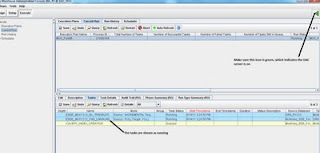
We can also see the status from informatica's workflow monitor. Notice the timestamp from both applications matches, so we know the executed DAC tasks do show up correctly in Infa's workflow monitor:
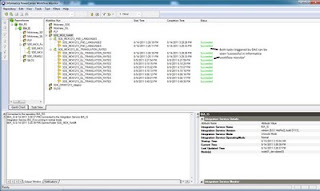
As we can see, the tasks have been completed successful, we have just completed this flow of configuration. Now if you want, you can use the scheduling feature to schedule this execution plan to run at your desired time and frequency. I won't go there this time.
I hope this series help. I highly recommend to read the DAC guide again to reinforce the information we just went through.
Thanks
Until next time.


1 comments:
Excellent !!
Post a Comment