Disclaimer

All of the topics discussed here in this blog comes from my real life encounters. They serve as references for future research. All of the data, contents and information presented in my entries have been altered and edited to protect the confidentiality and privacy of the clients.

Various scenarios of designing RPD and data modeling

Find the easiest and most straightforward way of designing RPD and data models that are dynamic and robust

Countless examples of dashboard and report design cases

Making the dashboard truly interactive

The concept of Business Intelligence

The most important concept ever need to understand to implement any successful OBIEE projects

Making it easy for beginners and business users

The perfect place for beginners to learn and get educated with Oracle Business Intelligence

Wednesday, June 2, 2010

Display dynamica default date value in dashboard prompt

I found this worth blogging for because it is fairly common that people want to put a default value on date dashboard prompts as current date or yesterday or any other dates that changes dynamically. So in this blog, I will just focus on setting current date as default in the date dashboard prompt.

Unlike column filters where we can enter 'current_date' in the SQL expression of the 'Add' tab of the filter property, we can't really do the same in dashboard prompt property. Therefore, the first way of doing it will be creating dynamic variable in Admin tool with a query statement like 'select sysdate from dual' in the initialization block, and call this dynamic variable in the dashboard prompt property (Go to prompt property ---Default to--- Server variable--- enter dynamic variable name).

I highly recommend creating this current date variable in every OBIEE project because it can be beneficial to a lot of people in a lot of areas with similar needs. However, creating this dynamic variable will requirement some level of configurations in the rpd, which will need time to have it ready to use in the presentation service. Let's say some users want to set current date as default in one of the dashboard prompt and it must be done asap, we can't just go configure the dynamic variable if we are talking about making changes in live production.

Therefore, we have another option.

In prompt property, go to 'default to' drop down and select 'SQL results'


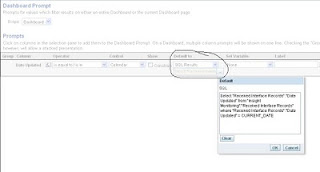
In the SQL result, enter this select statement (for my case): Select "Received Interface Records"."Date Updated" from "Insight Monitoring"."Received Interface Records" where "Received Interface Records"."Date Updated" = CURRENT_DATE

The table name and column name of this statement should be the same as displayed in column formula content, this is not where you expect to enter the physical SQL for database, so don't get confused with the statement you would enter dynamic initialization string.

After that, let's preview this prompt:


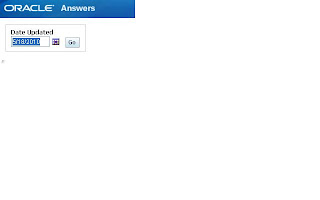
This method will give you instant result, however, some level of technical skill is needed. So use it depending on the expectation of your project and what level of training the business users have.

til next time

Saturday, May 29, 2010

Understanding Complex Join and Physical Join in OBIEE

What is the difference between complex join and physical join? The easiest way to understand the basic is to remember that physical join is used in Physical layer and complex join is used in BMM layer. However, just knowing that isn't going to be enough to build solid skills on OBIEE development. In order to gain more insight on how it really works in OBIEE, we need to know more about these 2 types of joins.

First, let's look at complex join:


The diagram is a window of a typical complex join. In here, you notice that you can't change any of the table columns of neither logical tables in the join and the expression pane is grayed out. However, you are able to change the type of join from inner to outer joins. This type of behavior is telling us that complex join is a logical join that OBIEE server looks at to determine the relationship between logical tables, in other words, it is just a placeholder. Complex join will not be able to tell the server what physical columns are used in joining, but it will be able to tell the server what type of join this is going to be..

In order to know how exactly the join is, we will need to look at physical join in the physical layer:


Notice that in this window of physical join, we are able to change the columns under both tables, we are also able to define our own expressions. However, are can't change the joining method unlike complex join. This behavior is to help us to know that this is where we tell OBIEE how to join the 2 actual tables by specifying the columns. Hence this is what physical join does.

Knowing the basic, let's take a step further. Can I use complex join in physical layer or can I use physical join in BMM layer? Yes we can, and by doing it the application will not flag errors. However, we need to know when to use them and what to expect after using them..

Let's look at complex join in physical layer. Although it doesn't happen frequently, it is sometimes needed. Let's say we have 2 tables, promotion fact and contract date dimension. I want to join these 2 tables in such way so that only the dates that are still in contract should return. Therefore, I can't just use a simple join on the date columns from both tables, conditions need to be applied.. In this case, let's use complex join in physical layer:


In the below diagram, I enter 'PTS_DATES.COMPANYDATEID >= PTS_STAR_FACTS.CONTRACTSTARTDATEID AND PTS_DATES.COMPANYDATEID <= PTS_STAR_FACTS.CONTRACTENDDATEID' to satisfy the joining condition. At the front end, when you run a report using these tables, this expression will be included in the where clause of the SQL Statement:


Having physical join in BMM layer is also acceptable, however it is very rare to see that happen. The purpose of having physical join in BMM layer is to override the physical join in physical layer. It allows users to define more complex joining logic there than they could using physical join in physical layer, in other words, it works similar to complex join in physical layer. Therefore, if we are already using complex join in physical layer for applying more join conditions, there is no need to follow this set up with physical join in BMM layer again.

Remember, the best data modeling design in OBIEE is not the most complex and overly convoluted design, it should be as straightforward as possible. Therefore, use physical join in physical layer and complex join in BMM layer as much as you can. Only when situation calls for a different join, then go for it.

Til next time

Monday, May 24, 2010

How to use Dynamic Variable in OBIEE

What is dynamic variable? According to OBIEE Admin guide, it is basically a variable that dynamically holds its value depending on the way it is defined. In this blog, I am going to talk about how to create dynamic variables and also how to apply them. The goal is for the beginners to get a good understanding of dynamic variable so that they will be able to apply them when situation calls for it.

Let's start with creating a very simple dynamic variable. I want this variable to always hold yesterday's date so that in OBIEE answers, I can always use this dynamic variable to any numbers of report.

Also, let's start with creating a new initialization block, it is basically the place to define the content of this variable and how it queries the desired value:


I am calling this initialization block "Yesterday" and in the 'Edit Data Source', I have ented select to_char(sysdate-1, 'dd-Mon-yyyy') from dual for the initialization string. The format of the SQL statement should be exactly the same as you would enter directly in the database. So a good practice in general is to try the query in your database to make sure it works before entering it in the initialization block. Keep in mind that depending on what type of database you are using, the SQL statement may not be supported. Therefore, lets test the initialization string and see how it works:


And it works. The connection pool should be the one used for the same physical tables in OBIEE.

Now let's associate this Initialization block to a new dynamic variable by clicking 'Edit Data Target':


I will just call this variable 'Yesterday'. So now this variable will always return yesterday's date.

Let's create another dynamic variable with slightly more complex logic. This time I want this variable to give me the current GL months, which is 7 months lagging current calendar month. Moreover, the first day of the GL month starts on every 15th day of each calendar month. Therefore, Let's write the following select statement:

SELECT DISTINCT a.posted_period gl_dashboard_period
FROM rd_glmart.v_gl_star_factsdetails a
WHERE a.posted_period =
TO_CHAR
(ADD_MONTHS (CASE
WHEN TO_CHAR (SYSDATE, 'dd') < '15' THEN (SYSDATE - 15) ELSE SYSDATE END, -7 ), 'yyyymm' )


Test and see the result:


Since today is May 14th and the result of this initialization string brings back 200909, I'd say it is pretty good.

Now I have two dynamic variables: Yesterday and GL Current Closed Period. Let's apply them in our reports.

Enter the name of the dynamic variable: GL Current Closed Period in the filter


And the result:


Til next time.

Monday, May 17, 2010

Filter based on the repetition of records in the column

Recently, I just came across a requirement that I think is worth blogging for beginner who's trying to manipulate the report data based on the the repetition of the data. Take a look at the following report:


You see, not every order number has only one corresponding document number. So how can I filter this report so that it only gives me back those order numbers that have more than 1 document number? Because there is no out of the box filter operator that allows us to easily create a filter based on such condition, we will have to work around it.

Let's first start by creating a report that counts the occurrence of every order number. So bring in a new column and call it 'count'. In the column formula, let's enter a formula: sum(count (distinct "Facts Info"."Order Number") by "Facts Info"."Order Number")


What this formula does is that it will count every order number's occurrence as 1 and them sum all the 1s by each order number. So the goal is that for those order numbers that have let's say 2 document numbers, these order numbers will repeat twice and there corresponding counts will be 2 in both lines after the 'Sum' function. So see the report below:


Now the hardest part is over. For the final report, we can then create a filter on column count. Now depending on what you want to see, you can get the order numbers that have 2 document numbers, 3 document numbers, less than 5 or however you want. For the purpose of this demonstration, I will just set this filter to be greater than 1, which means it will bring back all the order numbers that have more than 1 document numbers:


Run the report and here is the final result:


Of course, we can always hide the column count so that others don't see it in the report

Next time.

Wednesday, May 12, 2010

reporting against multiple transactional datasources

Recently, I came across a requirement that the users want to query against the transactional database using OBIEE. In our case, they literally want to pull data directly (meaning no ETL, no staging area in between) from the cash register of the retail stores nationwide. The databases of these stores are all sitting on different servers although they all have the same data structure. The goal is to be able to report these store data in 1 subject area in OBIEE with the functionality of letting users choose to report against 1 store data or numbers of store data together for totaling.

So let's explore how this can be implemented.

First, let's say I have successfully imported 2 sets of tables into my physical layer with different connection pool, and I have defined the join criteria among these tables.


First as we can see, there are two groups of tables coming from 2 different datasource, but their definitions identical. Therefore, we need to come up with a way to let OBIEE know how to distinguish these 2 sets of data. Therefore, I decided to add a new field in both sets call 'store number' and hard code this field with different values. This field will be used later to allow us to control the querying targets.

Since these datasource are within the store that we do not have control of, I decided to add a new physical column in each of the physical tables in OBIEE and change these physical tables to become views in order to define the value of the new column 'store number':


Test the data in column 'store number', it appears to be correct:


Now apply the same configuration to all physical tables in both physical database tables. We should have store number column in every table. The one from server 5th-ave is hardcoded 'NY' and the one from Dolphin is hardcoded '001'

Now bring both groups of tables into the same BMM layer folder. In each of the logical table, we should now have 2 different LTS. In each LTS, define the fragmentation content using 'store number':


This will be done in all Logical tables, and then move the wanted columns into presentation layer and after re-arranging, it looks like this:


Now let's go and test the query. In the subject area, the column store number will now content both 'NY' and '001', depending on which value we select, the result will come back accordingly.


So let's just run a simple report of store number and total amount received and see what we get:


If we look at the physical query that's generated, we will see that it fired 2 queries to both datasources and bring back the result :


This goes without saying that we can also just pick one store number and the report will come back with data from just one datasource.

One thing to keep in mind is that although there is no hard limit of how many datasource OBIEE is allowed to defined, meaning that I can have 50+ datasources defined in the same RPD without causing configuration errors (if this is actually required), there is practical limitations on how many datasources OBIEE can handle at the same time. This will depend on a lot of things, such as data size, reporting requirements, physical hardware, network connections. I can say that if the users want to report against 20 stores at the same time and see the grand total, the query will very likely be hanging for a long time. Hence, staging area and ETL effort will be a better option.

Nonetheless, for working around the requirement of having a few datasource in report, it can be done in OBIEE and still be practical.

til next time.

Thursday, May 6, 2010

The myth of OBIEE performance tuning

It is very common for people to think that when reports run for excessive amount of time, there is configurations or performance tunings that need to be done or enhanced witin OBIEE. It is as if OBIEE has the magic key to faster and better performance. At the surface level, the configurations and reports are done in OBIEE, it is natural for most people to think that the problem needs to be solved in OBIEE as well. That is fair.

However, when looking at reports with poor performance, there could be a lot of reasons behind it. OBIEE in essence creates SQL query that executes directly against the database, we can ensure the SQL query to be free of unnecessary clauses and nesting statements by following the best practice in OBIEE design. Yet, this only takes care of some of the the performance issues. It is true that OBIEE has several out of the box functionality for performance related needs, such as caching capability, aggregate tables, changing the log level and so on, but none of these are magic bullets in dealing with performance.

Caching is widely used in OBIEE projects. It offers help in query responses time by storing queries in cache. We can automate the process of refreshing caches by event pulling tables, or we can pre-run a lot of queries for cache seeding by using scheduled IBots. All these can maximize the benefit of caching reports. However, when entering into the OBIEE world, I can safely say that we are entering the Ad-hoc world. So in this case, caching isn't going to help completely.

Aggregate tables allow OBIEE to create separate tables aggregated at defined dimensional level, hence reduces the size of the record set. When certain queries that need to get data at that level, it can have an option to query smaller tables and return results quicker that way. This surely seem a pretty good option that deals with certain requests (but we know not for all). However, creating more physical tables mean spending more resources, and taking up for database spaces. If going down this path in the long run, the business needs to understand their infrastructure and know what they can afford in the long run. Therefore, aggregate table isn't going to help in all situations.

Everything else that can be done within OBIEE configuration is just be ensure the BI server can generate the best query to be executed. If the request runs for ever, we will need to look at the query and understand why it is running slowly. This becomes a question to both the business and technical people.

What is this query going to give you? What value will it add to the business with this report? I have seen requests composed of 45+ columns in one report. They would run for 30 minutes and come back with error, basically the number of records returned was too large. We can certainly increase the default setting of 65K in OBIEE to take care of the error part, but it will never prevent the error for good because the data is likely to increase over time. We can definitely spend lots of effort and time to tune the query or even schedule to cache this report everyday, but it will not help when Adhocing. More critically, if we decide to go down this path, we are leading the business to a wrong direction, and I can ensure that there will be more similar queries to tune in the future, which will never end. Therefore, the first step in making sure the reports are running fast is not to be in a situation where we have to deal with performance killing requests. This is not an easy thing to do because it involves on-going education to the business world about BI concepts and practices. The whole point about business intelligence is to avoid having to data dump millions of records into user's computer for them to slice & dice, it is about slicing & dicing data for them. It is a mindset change that will take time, but can't be done without clearly conveying the purpose and value of BI in the business world. Internet changes the way people obtain information, but the change didn't happen over night, same with BI.

From a technical perspective, when a fairly decent size request is taking a lot of time to return, it can be caused by a lot of things. How is the server machine's CPU usage? Does your database support the type of query you are running? Are you actually performing multiple requests and then union them? What type of table or view this query is running again?

One of the things that I like to do first is bring down the request into smaller ones that only consist of 1 joining operations to see which join is very slow. Chances are, if the query is taking for a long time, it is likely that the query is executing against huge data sets that are joined up. Knowing which join is slow can help us pinpoint the tuning target. For example, I have 1 report that has 12 columns from 4 tables running for 40 minutes in answers. By looking at the Sql statement of this request, I don't see anything particularly wrong in the query. Therefore, I decide to break it down to 3 columns from 1 dim and 1 fact table. The query is running with decent speed. Then I delete the columns from this dim and replace them with those from the second dim table in the original request. The query now is running for 25 minutes. So now I have my focus on investigating why querying these 2 tables take such a long time. Therefore, if i were to create Indexes on the joining columns, I at least when where to create it on. If the table size of these 2 tables are huge, then obviously the join between the 2 will be slow. If worse, these are actually views across more physical tables in the database that i am querying against, then the performance will obviously be slow. Therefore, we need to have detail understanding of the environment in order to determine the best thing to do.

There is no one simple change in the database or OBIEE that will eliminate performance issues one for all. When reports are running slow, we can't just tell the business to change their reports nor can we just throw it to the DBA to deal with it. Instead, we need to all work together and come up with the best solutions for all. Creating Indexes, hints or materialized views are easier to say than done without considering the impacts on the infrastructure side in the long run. In certain cases, capturing certain data may only be done using views to avoid re-writing the ETL process and other jobs. Therefore, the business would need to understand the situation and be willing to compromise certain things if they want better performance. On the other hand, we also have to thoroughly understand the business requirement to determine if there is any workaround available, only then the message can be accurately communicated and the expectation can be effectively managed.

In summary, the topic of performance tuning in OBIEE is a very broad topic that becomes performance tuning in general. There is no one solution or simple configurations that will take care of all the performance issues. It's all about cooperating, understanding, compromising, working around and coming up the best solutions for the project in the long run. It requires deep understand of the nature of one's project environment, data structures, project flows, business in order to come up with the best technical process and business practice in order to be on a good project path to start with. No matter how advance the tool is, if we are dealing with billions of records that outer joins another billions, we are going to have to wait.

Wednesday, April 21, 2010

Calculating the variances between the column sections in Pivot table

In the below report, we have a very standard pivot view which separates time based measures by dates in columns, and then applies a subtotal at column section level. Now what if instead of doing totaling on the 2 dates' measure, I want to apply variance between the two as indicated below?


The main challenge here is that all the values for different dates are all coming from the same table columns, it only appears to be different physical columns in the pivot view. Hence, we can't simply define a math formula within the measure column itself.

There are several ways to do it, I will show you the easiest way to do it. There is no need to create new measure columns with formulas or what not.

The first thing to do is clicking on the column 'snapshot date' under column section and click 'new calculated item':


Name this new item "Diff" in my case and now you can see the 2 date values on the right hand side for selection:


As you can see, I entered '$2-$1' in the formula instead of entering '4/12/2010 - 4/11/2010'. Both are going to take the measure values in snapshot column of 4/12/2010 and subtract from that of 4/11/2010. So just for the moment, both will produce the same result. However, by entering status date values in the calculated item formula will make the calculation status, therefore if the report changes it's snapshot date filter to be some other dates, we will have to go back to this item and check the date again. By entering '$2-$1' in the formula will allow this report to produce column variance dynamically. The '2' and '1' are the positions of the 2 columns so in this case, we are telling the server to use the second column (which is column 4/12/2010 at the moment) and subtract the first column (which is column 4/11/2010 at the moment). This will always give the right variance without having to manually change the formula:


Til next time.

Thursday, April 15, 2010

The fundamental understanding of Oracle Business Intelligence

There has been many times when during the interview I have asked or been asked the question "Could you explain to me what is OBIEE and what does it do?" This sounds like a really basic question that anybody can start with, which can also lead to so many different topics depending on the answers. I think this is worth blogging for specially after having had so many interviews or project related discussions with other professionals that have missed the point when speaking of OBIEE or even the topic of 'business intelligence' in general.

One of the most common response to the above question is that OBIEE is a reporting tool that can be used to create various reports and charts, Business Intelligence is the front end part of the data warehousing. I am not saying that this is the wrong answer at all. However, seeing OBIEE as just a reporting tool alone will make you miss the bigger picture. Certainly, from a pure technical perspective, OBIEE utilizes Kimball data modeling philosophy in its implementation design that enables users to view their business information, to analyze wide range of their business through the uses of reports, and various other views. It is typically the 'front end' of data warehouse process since most of the data & other objects that OBIEE deals with come from analytic database that is normally the receiving end of the ETL process sourcing from transactional database.

Indeed, as a pure technical OBIEE developer, the above could be mostly what they concern. However, the success of any BI project implementations start with the right understanding of OBIEE from a business perspective, only then the project can be set on a proper direction and expectations of the consumers can be effectively managed..

Therefore, following the response of "OBIEE being a reporting tool" comes my second question: "why would my company spend so much money to purchase this product if all we want is just to create some reports and charts?" Despite all the cool features of charting, pivoting, coloring of the reports that OBIEE provides, how would business get the biggest bang for their bucks by the purchase of this tool? Without knowing what OBIEE is really about, the project will likely go down the same path as before, only now each user is going to maintain 60 reports of 300K records each on OBIEE dashboard instead of on their excel spreadsheets like they did previously. I have seen or consulted on a few BI project implementations in the past where BI tool were used as a total duplication of what they were already doing and so we continued to customize our environment for the requirements that were fundamentally conflicting with the purpose of BI.

So what is OBIEE then? Well, in other to answer this question, we need to first ask ourselves this: what is business intelligence?

In my opinion, business intelligence is a realization of the concept of interacting with the complete inside world of one's business analytically, dynamically in order to gain thorough, accurate understanding of specific business areas for making better business decisions effectively and timely. Therefore, OBIEE is an application that implements the concept of business intelligence by the means of slicing & dicing huge volumes of data across numbers of data sources, and as a result, creates a platform of business information that enables users to adhoc query valuable information at will, view their information in a centralized and highly interactive platform that's easy for maintaining controls, and publish information that dynamically updates as business progresses.

In summary, implementing OBIEE in your business isn't just about having a new software tool, it is about adopting a new concept or a new business practice. Therefore, if all you want to do is having 30k records in several excel sheets to find whatever account that still owes certain amount of money since x number of years ago, then printing out tons of papers, then don't use OBIEE because the idea of OBIEE is to not have users to leave the dashboard or making users go through 65ooo records(the default max record setting) after downloading into excel, rather, it is about answering any specific business questions with spot-on answer. It's about making the mind of your business talk to you live.
Related Posts Plugin for WordPress, Blogger...