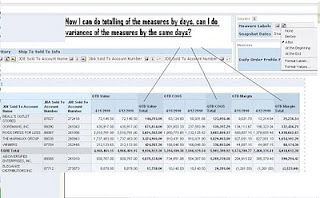
The main challenge here is that all the values for different dates are all coming from the same table columns, it only appears to be different physical columns in the pivot view. Hence, we can't simply define a math formula within the measure column itself.
There are several ways to do it, I will show you the easiest way to do it. There is no need to create new measure columns with formulas or what not.
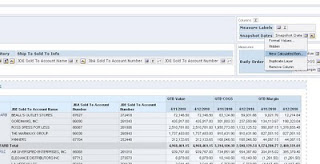
The first thing to do is clicking on the column 'snapshot date' under column section and click 'new calculated item':

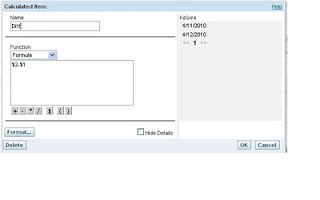
Name this new item "Diff" in my case and now you can see the 2 date values on the right hand side for selection:

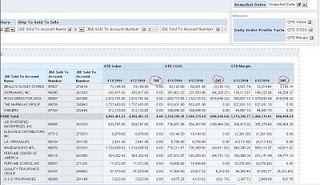
As you can see, I entered '$2-$1' in the formula instead of entering '4/12/2010 - 4/11/2010'. Both are going to take the measure values in snapshot column of 4/12/2010 and subtract from that of 4/11/2010. So just for the moment, both will produce the same result. However, by entering status date values in the calculated item formula will make the calculation status, therefore if the report changes it's snapshot date filter to be some other dates, we will have to go back to this item and check the date again. By entering '$2-$1' in the formula will allow this report to produce column variance dynamically. The '2' and '1' are the positions of the 2 columns so in this case, we are telling the server to use the second column (which is column 4/12/2010 at the moment) and subtract the first column (which is column 4/11/2010 at the moment). This will always give the right variance without having to manually change the formula:

Til next time.


8 comments:
Put a podcast Due also,
Nice Work,
Munna Bhai
Thank you. I will try that!
Thanks!
Hi,
I am amused at the solutions you provide.
I have a same scenario but with mutliple date intervals.
Ex- 5, Will this work then? How to i address the column positions ?
Is there any possibility of adding the '%' symbol for variance in percentage , because I created a one more column as '($1-$2)/$2*100 - This provides me variance in percenatge terms without teh percenatge symbol
Worked like a charm! Thank you so much for sharing this info. I have spent a few hours trying to figure out the CORRECT syntax to populate the date dynamically. Never occurred to me it would be $2 - $1, thought it would be something like with @ as a prefix.
Thanks again!!!
Hi
I am having the same situation but the variance needs to be taken for the dates. We want to capture the slippage in terms of dates on month on month basis. How could I achieve this?
Good Example but i need to have a rsum(DIFF) how it can be done? Please help
Post a Comment