Disclaimer

All of the topics discussed here in this blog comes from my real life encounters. They serve as references for future research. All of the data, contents and information presented in my entries have been altered and edited to protect the confidentiality and privacy of the clients.

Various scenarios of designing RPD and data modeling

Find the easiest and most straightforward way of designing RPD and data models that are dynamic and robust

Countless examples of dashboard and report design cases

Making the dashboard truly interactive

The concept of Business Intelligence

The most important concept ever need to understand to implement any successful OBIEE projects

Making it easy for beginners and business users

The perfect place for beginners to learn and get educated with Oracle Business Intelligence

Wednesday, July 25, 2012

Instring & Substring in OBIEE: How to trim data fields from or up to certain common characters

Hello there

Let's illustrate today's topic with a situation like below:

If you look at the data from the above column LSP name, you will find that all of the LSP names have an "_" in the middle somewhere. Well, except the one called "ingress-", which is an "-". However, the part before and after "_" may have different length. So now, if I want to display only the part before or after "_" regardless of the length or the location of "_", how would we do it?

Now let's start with thinking what we can do in the DB with a sql statement first. You see, what you would want to do initially is to find out the location of that character "_" in the text as a numeric value. Then based on the result, it will be used as the unit that you substring from. So let's look at the below SQL statement:

Select lsp_name, substr(lsp_name,1,f_s_l-1), substr(lsp_name,f_s_l+1) 
From 
(Select lsp_name, instr(lsp_name,'_') f_s_l 
From is_smb_lsp_dim 
)

Now the "instr" function will pick up the location of "_", and the "substr" function will decide how many characters to keep. "f_s_l" is basically an alias of "instr(lsp_name,'_')".  So the result of this statement is satisfactory:


Now, let's see how we can translate this SQL in OBIEE. 

First of all, OBIEE doesn't have Instring function as a built in, the substring function also has a different syntax. However, the locate function in OBIEE does similar things like Instr. So we will start by creating a new column in the report that identifies the location of "_". We call it "Location".

The expression is "LOCATE('_',LSP."LSP Name")".


Now that this is working, we should move on to doing the substring. However, since the location of "_" is different from row to row, we will need to figure out what is the length of this column at each row first. So here, we use the "length" function and create another column called "length". Let's see what happen:


Now this is displaying the length of each row, so let's start with substring. In OBIEE, the subtring function takes the following syntax:


SUBSTRING(column name FROM integer FOR integer)

Therefore in our case, the column name is LSP name, and the "From" part has to be where the character "_" appears in each row. "For" should be the length of the characters it is subtringing.

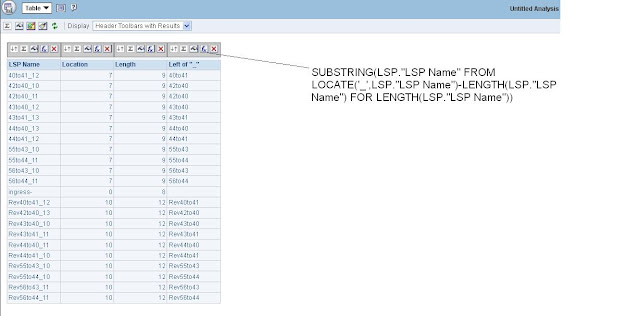
After a few trials and errors, I have decided to enter the following code using length function in the "for" part
SUBSTRING(LSP."LSP Name" FROM LOCATE('_',LSP."LSP Name")-LENGTH(LSP."LSP Name") FOR LENGTH(LSP."LSP Name")). This will only return all of the characters before the "_". So I decided to test it out by creating another column and calling it "Left Of _" and it is working:


Now, if I want to display everything after "_", I will modify the code especially the "from" part to the following:


SUBSTRING(LSP."LSP Name" FROM LOCATE('_',LSP."LSP Name")+1 FOR LENGTH(LSP."LSP Name"))

The "+1" in the "from" part will get rid of "_" itself, which is desired. Hence, changing the formula of "Left Of _" with the new code will produce the following result:


So now everything is working.

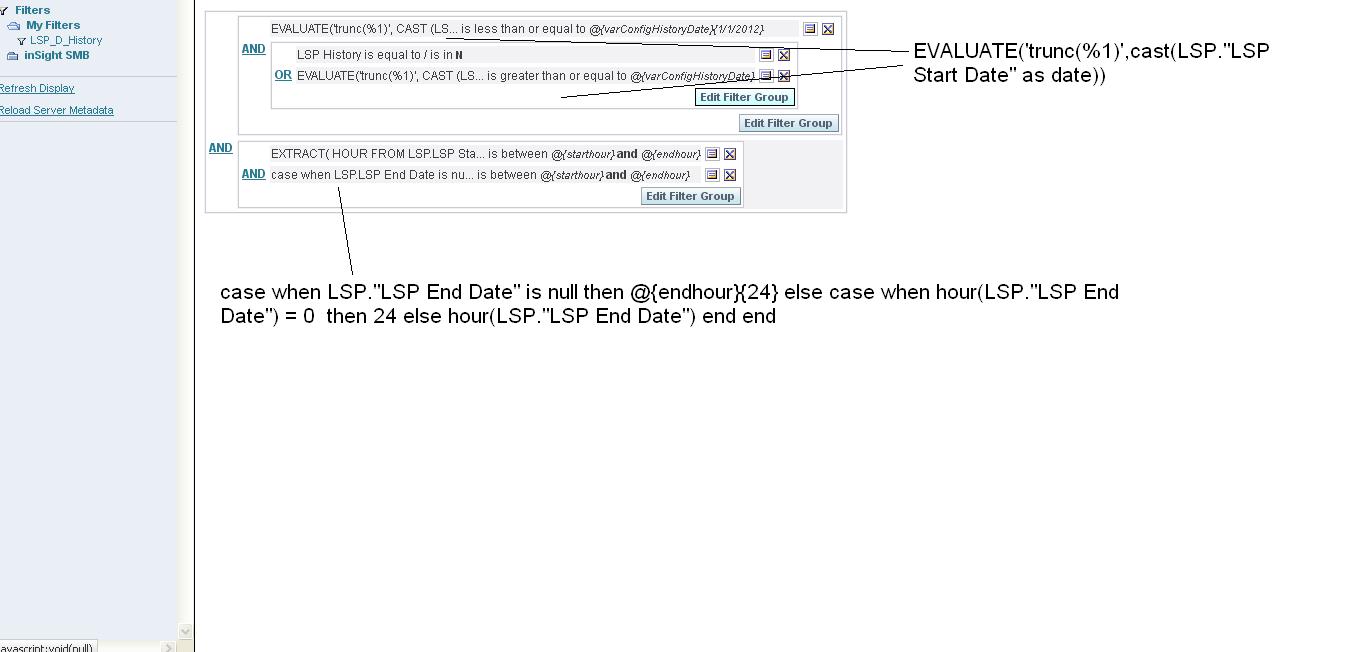
Of course, in my design I have eventually decided to derive this logic from the back end where the RPD is developed. The place to do it is in BMM layer and it is the same syntax:


And the actual code I am entering is following with a case condition:
 CASE  WHEN "inSightSMB".""."inSightSMB"."A6_IS_SMB_NODE_INTERFACE_DIM"."INTERFACE_TYPE" LIKE '%VLAN%' THEN  SUBSTRING("inSightSMB".""."inSightSMB"."A6_IS_SMB_NODE_INTERFACE_DIM"."INTERFACE_NAME_ALIAS" FROM  LOCATE('.', "inSightSMB".""."inSightSMB"."A6_IS_SMB_NODE_INTERFACE_DIM"."INTERFACE_NAME_ALIAS") -  LENGTH("inSightSMB".""."inSightSMB"."A6_IS_SMB_NODE_INTERFACE_DIM"."INTERFACE_NAME_ALIAS") FOR  LENGTH("inSightSMB".""."inSightSMB"."A6_IS_SMB_NODE_INTERFACE_DIM"."INTERFACE_NAME_ALIAS")) ELSE 'N/A' END

Thanks

Until next time


Sunday, July 22, 2012

OBIEE Project Case Study 1 ---- Dealing with complex filtering requirement Part 1

Hello again.

So today I want to talk about the requirement I came across during the project, which is about seeing the data they want to see based on the filter criteria selected on the dashboard. Like any requirement gathering process, we have analyzed the requirement, translated into the technical language and built the report as first cut. During the validation stage, as the analysts and designated users played around with the reports, they have brought more points that they wanted to see modifying. This is quite easy to understand since we can just point at the rows in the report and say what want it or not. Yet, the scenario is still quite complex that required several days of trials and errors.

So let's look at the following report:


The above is just an example. It shows a list of objects (LSPs) and their start and end time. By the way, in any data warehouse projects, keeping historical record is always a big topic. It is essential to filter the right historical data accurately. Back to this requirement. We have start/end date that goes for 3 days. In each day, LSP starts and ends at different hours. There are also LSPs that doesn't have end date, which means it is still active now. 

Now the requirement is that:
1. when user enters a date (July 20th) in the dashboard prompt, that report should return all of the LSPs that starts on that date or prior (anything less than or equal July 20th). Then end date should be after or on that date (July 20th)
2. If the record has no end date, that means it is currently active, so as long as its start date is earlier than user entered date (July 20th), it should come on to the report no matter what.
3. If the record has end dates, then based on the hours that users select, only those that starts and end within the hour selected should come on to the report along with those that doesn't have end date.
4. If a record that doesn't start between the hours selected by the users, however it ends during the hours, it should still show up on the report. In other words, if selected range is 9-12, when a lSP started at 7 but ends at 11, it should still show up.
5. If an object starts at 23 and ends on 0 the next day, it should still be consider as current date record, it should show on the report when user set the start hour as 23 of that date even if the end date is 0 the next day.
6. All of the hour prompt values still have to base on the date prompt values. In other words, if the date prompt value is on a specific date like July 20th, then all of the records should be on or prior to july 20th, then within this result set, users can zoom in their search by selecting specific hourly period to see what LSP is active at this period, meaning either it starts or ends during this period, or starts at this period and never ends.

So enough said, it looks too much for me to grasp and get it all right at once. But it may not be as bad as it looks if I break things down into smaller components and tackle them one at the time..

First of all, the start and end date from the report is a timestamp and it has to show this way in the report. The date prompt is passing only date data type. So my first step is to add a few columns on the report by creating a date column and hour column. So we know have LSP Start/end date and LSP Start/End Hour. I will use the date column to filter from the date prompt and hour columns to filter hour prompt values. 

The formula for both columns are pretty simple. use cast(lsp start date as date) will give you only date value, and use hour(lsp start date) will give you the hour of the day with numbers from 0 to 23. Now for end hour, I decided to convert 0 to 24 for the requirement outlined in 5. I made the same change for the dashboard prompt so start hour prompt will have 0 to 23 in the drop down and end hour will have 1 to 24 in the drop down. 

Based on this set up, I have finally created the below filter sets after 3 days of trials and errors:


So let's walk through it.

The first set of filter takes care of the date part of the requirement. I am taking values passed from the prompt via a presentation variable "varconfighistorydate", then compare it with start date (without time) and end date (without time). It is greater than or equal start date and less than or equal end date to make sure it fall in between.

Then I have 2 other filter conditions for the hours. The start hour is between the 2 values passed from the prompt with values "starthour" and "endhour". Because it is also required to return records that ends on the same hour range even if it doesn't start within the same range as outlined in 4 from above, I also have to create the same filter for end hour column as well. 

Now here is the tricky thing as indicated in item 3 from the requirement list that, if the record doesn't have an end date, it should show up on the report as long as its start hour is in the range of hours. This means, I have to find a way to populate the end hour with a certain value that will always match the selected value from the hour prompt when the corresponding end date is Null.

So after some deliberation, I have decided to enter the following formula for end date column:
Case when LSP End date is NULL then @{endhour}{24} else case when hour(lsp end date) = 0 then 24 else hour(lsp end date) end end

In other words, when there is no end date, this column will have the same value as whatever selected from the end hour prompt on the dashboard, guaranteeing it being picked anytime.

It is also important to "AND" these 2 set of filter groups as they have to work both at the same time. I have tried "OR" and requirement 6 from the above list failed.

Now it is working as expected as shown the below 3 screenshots with each representing each date value selected:


Playing with the hour numbers, the report also changes display according to the expectation.

So the bottom-line is, when it comes to dealing with requirements that seems too complex at once, it's better to slow down, and break it down to smaller pieces. Figure out what are the must-haves, from there, keep building with more layers.

Thanks, 

Until next time.


PS: I have realized later on that the solutions described in this post isn't 100% correct. Therefore, I have added another post as a follow up for this one with a complete solutions.


Tuesday, July 17, 2012

Dynamically reporting based on date or time with presentation variable -- Part 2


So continuing on with the issue previously discussed, I have decided to start with creating a few prompts that will at least dynamically switch between "date" and "hour". The technique used here is the same as in this entry. The prompt created will look like the following:

I call it Time scale granularity. This prompt will give only two hardcoded values "day" and "hour", which by setting a presentation variable "vardateselect", will be passed to the next prompts I am going to create.

Because the requirement is to be able to select a range of dates from the prompt, so I will just create a normal date prompt with "is between" operator and I set the default value to be "current date". This is a standard prompt, nothing fancy:


Now when it comes to hourly prompt, things get a little trickier. 

You see, because it is also required to select a range of hours, you would naturally want to use "is between" operator for this one. But the problem here is that the prompt value will not be able to pass to the reports with presentation variables if more than one value is allowed. Also remember, users are not allowed to select any hourly values if they are querying reports with date granularity. We need to think of a way to control the display of hour prompts based on the granularity. Therefore, I have decided to create 2 separate prompts on the same hour column and work around it. 


As you can see, the idea is that I am fooling OBIEE into thinking that these are two different prompts that they are not by entering different prompt formulas that really aren't different. Both formulas will take the values passed from the time scale granularity prompt, and if the value happens to be "date", then neither prompts will have any values showing in the drop-down selection. In other words, users will only be able to select any hours when they choose "hour" from the time scale granularity prompt. 

In the "show" result area, I am entering a logical SQL mainly for sorting these hours numerically. Then both prompts will pass their values via new presentation variables that I set here "Hour1" and "Hour2".

Now save this prompt and move on to creating the report.

In the report, we are going to use both date column and hour column. Like I previously mentioned, because the date and hour are different data types, we can't simply use one column and conditionally change its content. So we will define the formula of these columns separately. 

In the Date-- Y Axis column, we will make it date only if the presentation variable "vardateselect" = 'day', and for the Hour - Y Axis column, its only hour when presentation variable "vardateselect" = 'hour'.


Now, let's add the rest of the columns on to the report including the measures. I have also created a column call "title" and this column will return 2 hard coded values based on the values passed by presentation variable "vardateselect". It will display either 'dately utilization' or 'hourly utilization'. This column will be referred on the title display of the report, so that the report will dynamically change its name based on the granularity that users select.


Now, let's create a chart view on this report. Here, we put both date and hour columns on the X-Axis ( or Y Axis if you want), I changed my mind at the last second to have it on horizontal axis.


In the narrative view, simply call the 'title' column on the narrative content. In my case, the title column is the 8th column from left in the criteria.


Then, create a filters that we desire to receive values from the dashboard prompt. For most of the filters, just set it "is prompted" because they are not receiving presentation variables. However, for the hour filter, we will put the filter equal to the 2 presentation variables we set in the hour prompt, "hour1" and "hour2". I have also defaulted hour1 as 0 and hour2 as 23, so it will return all of the hours of the day initially.

Now let's save this report. After creating the dashboard and putting all of the prompts and reports on there, it will look like this:


As you can see, the default time granularity is set to be "day", and therefore, the drop-downs on the hour prompts are basically empty. Now let's select the date range in the date prompt and click go:


As expected, the title of this report is displaying words like "Daily peak utilization" and on the X Axis, it is showing only days.

Now let's change the time granularity to "hour" and click go and see what happen.


Again as expected, the title of the report changes to "hourly utilization" and hourly data are displayed on the X Axis this time, hence the graph changes shape accordingly. More importantly, the drop-downs of the hour prompts are filled with data for selections:


Now all I have to do is change the prompt values for the hour prompts. By selecting values on both hour prompts, the query will return data between these 2 selected values:


So now, this is all completed. You can play around with this. I am sure it will work just as fine if you want to add month or even year into the same report.

Thanks

Until next time..


Wednesday, July 4, 2012

Dynamically reporting based on date or time with presentation variable -- Part 1

In the past, I have come across requirements that need to build 1 report where user can dynamically choose the time period as monthly or yearly based on user input from the dashboard. I have documented the process of building that report in the previous post. However, there was an issue with that approach. It is that this will only work when the 2 columns have the same data type. Now what if users want to see a graph where on the Y Axis would should a range of dates when it is "daily report", and then want to see a range of hours when it is "hourly" report? 

The important thing to have in the report in order to make it valuable to the user is to be able to control the number of plots on the graph if user select 30 days on the graph. In this case, obviously if the hours are also displayed, then the graph will be unreadable. Yet at the same time, they also want to be able to see the measures at hourly basis for a specific day.

Now using column selector on the compound view is one workaround, but it is not the desired solution because we want to be able to use 1 global dashboard prompt to control all of the graphs to be either daily or hourly.  So understanding the required features, we will have to make sure the query does several things to be right. 

First of all, What's being displayed on the Y Axis of the graph should be either dates or hours depending on what users choose from the prompt. That means both columns should be included on the Y Axis however, the content of the two columns should be null when user doesn't select the corresponding time scale. 

Secondly, the measures on the graph should be summed at daily level when it is daily graph, and should be at hourly level when it is hourly graph. 

Thirdly, the hourly prompt should not be used if user wants to query daily reports.

Having realized all these challenges, we have to come up with a way to implement this chart. Although previously I have done something similar by passing presentation variable value into the report and dynamically changing the content of the field with a case statement, this is trickier. According to that method, I would create a dummy column in the report and enter something like "case when presentation variable = 'Day' then day.date when presentation variable = 'hour' then day,hour end". It can not be done here. Because date and hour are completely different data type and can not be used in 1 column. Therefore, something different has to be done.

Another challenge here is that, since the prompt on the dashboard is for selecting range of dates or hours, or is using "is between" operator, how would I pass these values into the report using presentation variable will become an issue. I can no longer prompt the report filter to achieve the same since it is going to be driven by variables. 

After some struggling, I have come up with a solution and it is working great. Although I have only tested it in 10g environment, I believe the same thing applies in 11g.  I will post my solution on the next entry

Until next time

Related Posts Plugin for WordPress, Blogger...