So continuing on with the issue previously discussed, I have decided to start with creating a few prompts that will at least dynamically switch between "date" and "hour". The technique used here is the same as in this entry. The prompt created will look like the following:
I call it Time scale granularity. This prompt will give only two hardcoded values "day" and "hour", which by setting a presentation variable "vardateselect", will be passed to the next prompts I am going to create.
Because the requirement is to be able to select a range of dates from the prompt, so I will just create a normal date prompt with "is between" operator and I set the default value to be "current date". This is a standard prompt, nothing fancy:
Now when it comes to hourly prompt, things get a little trickier.
You see, because it is also required to select a range of hours, you would naturally want to use "is between" operator for this one. But the problem here is that the prompt value will not be able to pass to the reports with presentation variables if more than one value is allowed. Also remember, users are not allowed to select any hourly values if they are querying reports with date granularity. We need to think of a way to control the display of hour prompts based on the granularity. Therefore, I have decided to create 2 separate prompts on the same hour column and work around it.
As you can see, the idea is that I am fooling OBIEE into thinking that these are two different prompts that they are not by entering different prompt formulas that really aren't different. Both formulas will take the values passed from the time scale granularity prompt, and if the value happens to be "date", then neither prompts will have any values showing in the drop-down selection. In other words, users will only be able to select any hours when they choose "hour" from the time scale granularity prompt.
In the "show" result area, I am entering a logical SQL mainly for sorting these hours numerically. Then both prompts will pass their values via new presentation variables that I set here "Hour1" and "Hour2".
Now save this prompt and move on to creating the report.
In the report, we are going to use both date column and hour column. Like I previously mentioned, because the date and hour are different data types, we can't simply use one column and conditionally change its content. So we will define the formula of these columns separately.
In the Date-- Y Axis column, we will make it date only if the presentation variable "vardateselect" = 'day', and for the Hour - Y Axis column, its only hour when presentation variable "vardateselect" = 'hour'.
Now, let's add the rest of the columns on to the report including the measures. I have also created a column call "title" and this column will return 2 hard coded values based on the values passed by presentation variable "vardateselect". It will display either 'dately utilization' or 'hourly utilization'. This column will be referred on the title display of the report, so that the report will dynamically change its name based on the granularity that users select.
Now, let's create a chart view on this report. Here, we put both date and hour columns on the X-Axis ( or Y Axis if you want), I changed my mind at the last second to have it on horizontal axis.
In the narrative view, simply call the 'title' column on the narrative content. In my case, the title column is the 8th column from left in the criteria.
Then, create a filters that we desire to receive values from the dashboard prompt. For most of the filters, just set it "is prompted" because they are not receiving presentation variables. However, for the hour filter, we will put the filter equal to the 2 presentation variables we set in the hour prompt, "hour1" and "hour2". I have also defaulted hour1 as 0 and hour2 as 23, so it will return all of the hours of the day initially.
Now let's save this report. After creating the dashboard and putting all of the prompts and reports on there, it will look like this:
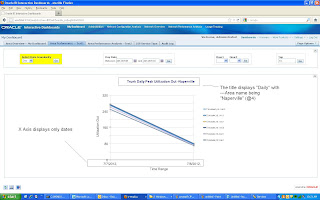
As you can see, the default time granularity is set to be "day", and therefore, the drop-downs on the hour prompts are basically empty. Now let's select the date range in the date prompt and click go:
As expected, the title of this report is displaying words like "Daily peak utilization" and on the X Axis, it is showing only days.
Now let's change the time granularity to "hour" and click go and see what happen.
Again as expected, the title of the report changes to "hourly utilization" and hourly data are displayed on the X Axis this time, hence the graph changes shape accordingly. More importantly, the drop-downs of the hour prompts are filled with data for selections:
Now all I have to do is change the prompt values for the hour prompts. By selecting values on both hour prompts, the query will return data between these 2 selected values:
So now, this is all completed. You can play around with this. I am sure it will work just as fine if you want to add month or even year into the same report.
Thanks
Until next time..


0 comments:
Post a Comment