Disclaimer

All of the topics discussed here in this blog comes from my real life encounters. They serve as references for future research. All of the data, contents and information presented in my entries have been altered and edited to protect the confidentiality and privacy of the clients.

Various scenarios of designing RPD and data modeling

Find the easiest and most straightforward way of designing RPD and data models that are dynamic and robust

Countless examples of dashboard and report design cases

Making the dashboard truly interactive

The concept of Business Intelligence

The most important concept ever need to understand to implement any successful OBIEE projects

Making it easy for beginners and business users

The perfect place for beginners to learn and get educated with Oracle Business Intelligence

Wednesday, March 28, 2012

OBIEE On Mobile Devices


This is no something that just became available yesterday. The ability to gain access to OBIEE through mobile devices such as Iphone, Ipad is going to become a way going to the future. OBIEE has the feature to do just that. After all, smart phone's raising popularity is changing the way we interact with the world.

If you want to know how to set up OBIEE Mobile, oracle has an excellent document. This is not as complicated as we might think, nor is it the same as we used to understand as Disconnected Analytics.


Have fun playing!

Until next time

Saturday, March 24, 2012

OBIEE 11G: Dealing with errors when starting Services


Hello again

You can see that OBIEE 11g has made a lot of architectural changes from 10g. When it comes to managing services, it is done on weblogic instead of managing it as OS services manually. In this entry, we will just go over something simple yet common scenario of starting services, it is helpful in getting familiar with how 11g works.

So, let's start with a problem that I can't have access to the presentation service, the link isn't working.

The first thing I do is by going to the Weblogic's enterprise manager to see what services are currently running. As you can see, the BI Presenation Service is down for some reasons..


Ok, that's simple. Let's click on the "start" button in the same interface, it should work. However, I run into errors and the presentation service failed to start. In the "Diagnosis" tab, it shows me a list of errors:


Most of the errors are complaining about both component coreapplication_obips1 and BI Security Service being unavailable or down:

Operation Failed: Start; OracleInstance: Instance1: Component: Coreapplication_obips1: ...............

[13037]Cannot connect to BI security service, please make sure this is running properly .................

[13037]Error in getting roles from BI security service .................

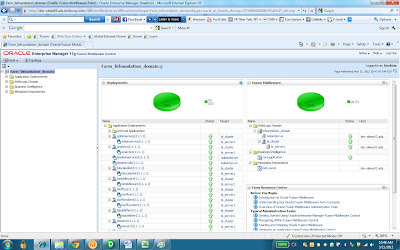
Now, how do I know where to go from here? Let's check weblogic domain:

You can see that something is not running from there, it is the BI_Server1 not running.
So, this is telling me to go look in Admin console and see how are the servers doing in BIFoundation_Domain.

Going to Admin Console:


Here the BI_Server1 needs to be started. Let's do with by going to the change center on the upper left side of the screen and "lock and edit" to enable the changing feature. Then go to 'Control' in the server pane and select BI_Server1 in order to start it:

Don't forget to go back to the change center and click "release configuration"

The BI_Server1 is running now. So now let's go back to enterprise manager to start presentation service. As it turns out, the service is started successfully this time:


Thanks

Until next time


Thursday, March 22, 2012

OBIEE 11G: Easy way to understand the High-Level Architecture and Sub-components

Hello here again.

Today I want to talk about the OBIEE 11g's architecture and how to navigate through some of the important components. 11g utilizes the concept of web logic, which makes its architecture very different from 10g. There are a lot of documents and articles that gives excellent introductions on how it works. However, nothing really clicks unless you actually work on it.

Therefore, I am going to lay out the basic ways to look at 11g's architecture from a 10g user's perspective. Why is this helpful? Because for those who are familiar with 10g already, they will be looking for the same thing in 11g. Only if you can establish this connection between how it works in 10g and how it works in 11g, you can then truly understand 11g's architecture. Learning from scratch will be simply too much work.

So let's start with this popular diagram of 11g architecture and see if we can make some kind of association with how it used to work in 10g:


So now how do I know what is what if I haven't used 11g yet, right?

A person who have used 10g before would want to know where is my BI server, where is my presentation server, OC4J, scheduler server and so on... We will get to all these places shortly.

Let's first talk about the components in the 'Weblogic Domain', namely the Admin Console and Enterprise Manager. I won't go into details about what they are and how they work in 11g architecture. Let's make it simple by assuming the Admin Console is available after installation.

First start WebLogic Server admin server, which enables to log in to the weblogic Admin Console: http://localhost:7001/console

Upon login, the interface will look at the following:


In the domain structure pane on the left hand side, we have 1 domain, which is BIFoundation_Domain. Domain can be created using weblogic tool’s Configuration wizard.

Under this domain, we have a list of nodes. The first one is ‘environment’. Underneath this node, we have a list of subjects, one is ‘server’, which is typically referred to as ‘managed servers’ in the 11G Architectural diagram:


Just to mention, in case you want to know where and how to set up the security authentication in 11g, it is also done here in Admin console. Under 'security realm'. There you can go further by setting up the LDAP server embedded in weblogic server, which allows you to create and manage users and groups:


However, that will be for another time. For the time being, let's move on with the overall architecture by clicking on ‘servers’ and we will see a list of managed servers under this domain. In my case, I have two servers.


The highlighted server is the managed server that once started, will automatically start the Java component and OPMN (referred to as the right side of the OBIEE 11G Architecture Diagram)

This should allow us to log in to the Oracle Enterprise Manager as referred to as ‘Enterprise Mgr’ on the left side of the architecture diagram under ‘Admin Console’. Typically, we can access to the enterprise manager via the url: http://localhost:7001/em

Here on the left pane, we can see the Weblogic Domain is what is in Admin console being BIFoundation_Doman.

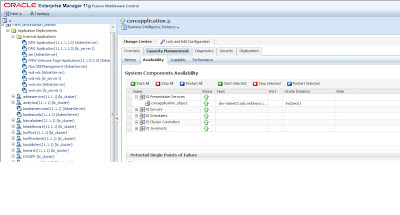
The OBIEE components are under ‘Business Intelligence’ Node. In our case it is called ‘CoreApplication’. Click on it, and go to capacity management, we will see a list of OBIEE related services:


This is where we can manage to start/stop any of the OBIEE services, such as Presenation Service, BI Server, Scheduler Server that we are familiar in 10G.

This place is also used when we want to publish a new RPD. Simply go to ‘Deploy’ tab, which is the rightmost tab:


This is where we can upload a new RPD and webcat to publish. Simply click ‘Lock And Edit Configuration’ next to the ‘change center’ slightly above ‘Overview’ tab and start the process. I won’t go into it now.

That is pretty much it for an overview. It will take some time to get used to, but overall it is a pretty simple process.

Until next time.

Tuesday, March 20, 2012

OBIEE11G Presentation Variable To Dynamically Switch Filtered Column Values Based On Dashboard Prompt Values

Hello Again

Today, I want to blog about a scenario that I have encountered, which is very interesting to me. Let me describe the scenario without getting too much into details.

In the dashboard, the user want to be able to have an option to filter either by Month or by Year with a switch. In other words, the first thing they want to do on a dashboard is to select the option of "Year" or "Month". Once the option is selected, the next prompt will change to either filter by "Year" value or by "Month" value. The report that they are querying against is the same report that show be able to go either 'year' or 'month'.

So let's get on with it.


The first thing that needs to be done is create this "switch" on the dashboard. This is basically another dashboard prompt that should only return 2 values, 'Year' and 'Month'. To do so, let's create a dashboard prompt and call it 'Time'. In my case, I randomly pick "Fiscal Period" column from table "Time" in Subject Area "Financials - AP Transactions".

In the prompt creation list, go to 'Option' and set the "choice list value" to 'Show SQL result'. In the box, enter the following code:

SELECT case when 0= 1 then "Time"."Fiscal Period" else 'Year' end FROM "Financials - AP Transactions" union all SELECT case when 0= 1 then "Time"."Fiscal Period" else 'Month' end FROM "Financials - AP Transactions"


The code will generate 2 values 'Year' and 'Month' as a result of the union of 2 select statement. Each select statement will return one of the 2 values because the condition '0 = 1' is always false.

If you notice, at the bottom of the this window where "Set A Variable" is filled with Presentation Variable. This is how to set a presentation variable using Dashboard Prompt. This time, the variable is named 'Time'. My purpose is the pass this variable into the next prompt that I am about to create.

The idea is that, the variable 'Time' will hold one of the 2 values of 'Year' or 'Month' depending on which is selected by the user. Then the next prompt will use this variable to determine whether it should return year column data or month column data.

Therefore, the next prompt that I am creating is called 'Period' with a 'between' operator.

So let's take a look at this next prompt 'Period':


In here, the first thing I do is edit the column formula. Since this prompt is also created based on a randomly chosen column, I have to define it's content. This time, the expression is:

case when '@{Time}' = 'Month' then "Time"."Fiscal Period" when '@{Time}' = 'Year' then "Time"."Fiscal Year" else 'N/A' end

As you can see, it is a condition saying that if Presentation Variable 'Time' happens to be 'Year', then this column should be "Fiscal Year"; if Presentation Variable 'Time' happens to be 'Month', then this column should be "Fiscal Period", otherwise it is 'N/A'.

Now back to the prompt creation window. Again here we have to set the Choice value list to be 'Show SQL Result'. By doing so, the logical sql statement is automatically generated with the above condition embedded into the select statement.


Here as you can see, I set another presentation variable call 'Period'. My goal is to use this variable as the filter condition for the report.

So let's preview these 2 prompts and see how they look like:

So as you can see from above. The prompt 'Time' has only 2 values 'Year' and 'Month' in the drop down list. You can select either one and hit 'Apply', then the content of the drop down list of prompt 'Period' will hold either years or month data. Just remember to hit 'Apply' after picking 'Year' or 'Month' from the first prompt in order to see the updated list of the second prompt.

So far so good. Now let's create a simple report with only 1 field for testing purpose. Here I again randomly pick a column calling it 'Period' from the subject area for this report, then I have to edit the column formula to allow it to be either year column or month column depending on the presentation variables. Same logic here as in the second prompt 'Period'.

The expression is again:
case when '@{Time}' = 'Month' then "Time"."Fiscal Period" when '@{Time}' = 'Year' then "Time"."Fiscal Year" else 'N/A' end


Then, we need to create a filter condition on this column so that it will filter the values coming from the second prompt's presentation value. In this case, the filter condition is 'equal to' the name of the presentation variable 'Period':


Now, let's put everything together on a dashboard and see how everything works:


Let's pick 'Year' and click 'Apply'. Then you can see a list of years in the drop-down of the select prompt:


In this example, I select between 2003 to 2005 as my prompt value. Then I hit 'Apply' again to see the result of the report:


Now let's go back and try 'Month' and see what happen:


After selecting the period from BB-11 to JUL - 10 in the prompt, I hit 'Apply' and here we go:


So this is successfully done. If this set up works, the rest is easy. You can then incorporate this report with real data and it will work the same way..

Until next time


Configuring Incremental Loading In Oracle BI Apps Part 5

So far we have been configuring Informatica to implement the incremental mapping logic. The last piece is to configure DAC to run these workflows and to ask DAC to tell informatica what these parameter values should be. It is a fairly simple configuration that I will take you through now.

Here in DAC, we already have 2 source system parameters, so now we can go ahead and create a task for PA_EVENT:


Notice that in the Task set up, there are 2 fields:

Commend for Incremental Load and Commend for Full Load

In there, we will enter the specific Informatica workflow names for each field. Simple as that.

Now, we need to define the values for the parameters used in lookup override. In this case, the value for $$Lookup_input10 to 12 will be the name of each of the 3 primary key columns. Make sure the name of the columns should match the order of the parameters in the lookup transformation. Then the $$Target_Table will be the name of the target table in the mapping, or "PA_EVENT" in this case:


Notice that these are task parameters, not the source system parameters. Therefore, these parameters are only applicable to this specific task while $$last_extract_date being the source system parameter can be applied to all tasks.

This is really the end of the configuration in DAC. Moving forward, just add the task in certain subject area and run it as part of an execution plan. The corresponding workflow will be triggered depending on the situation.

As I mentioned before in part 1, there are many different ways to implement incremental loading in BI Apps, none is better nor worse. They all have advantages in certain situation.

This approach basically lets DAC to be in control in the event of any changes. We can simply edit the value of the parameters in DAC while leaving Informatica as it is.

Also, if we see that there are a list of tables that all have similar patterns of update, such as having the same number of primary key columns with the same data types, we can simply create a mapplet doing the lookup part, then apply it to all of those mappings.

The bottom-line is, depending on the real life situation, we get to choose how we want to set things up. Nonetheless, the logic of incremental loading is more or less the same, I hope this series of articles will give beginners a detailed and comprehensive understanding of how to implement such kind of mappings in BI Apps.

Thanks and until next time

Thursday, March 15, 2012

Configuring Incremental Loading In Oracle BI Apps Part 4


From last time, we just went through the whole process of building the Informatica Mapping with incremental logic. This time, let's create the session and workflow.

The process of doing it is pretty standard and straightforward, I will just high line the few areas that needs attention.

First of all, we will have 2 sessions and 2 workflows, one for full load and the other for incremental load. Both session will use the same mapping that we just created.

So I have 2 sessions: SDE_MCK1213_PA_EVENTS and SDE_MCK1213_PA_EVENTS_FULL

The SDE_MCK1213_PA_EVENTS session is for incremental loading, therefore there are a few difference from the full load versions:

1. Treat Source Row As Data Driven Instead of "Insert" for Full Load

2. Target Load Type is "Normal" instead of "Bulk" for Full Load


3. The Source Filter for the incremental session should have the parameter "$$LAST_UPDATE_FILTER". For the Full Load Session, it should be removed and left blank.


After that, I created 2 workflows and 1 for each session. For simplicity, I am giving the same name as session names. That's all there is for setting up 2 workflows and 2 sessions.

We will now go into DAC with the 2 workflows:
SDE_MCK1213_PA_EVENTS and SDE_MCK1213_PA_EVENTS_FULL

Until Next Time


Monday, March 12, 2012

Configuring Incremental Loading In Oracle BI Apps Part 3

In the previous post, we have covered up until configuring the lookup transformation. So now we know that we have 1 output from lookup transformation and it is brought into the expression transformation.

So from there, as we know that the lookup output are either going to have a list of records that satisfies the lookup condition or it is NULL when it doesn't satisfy the condition. In expression, will define meanings for the NULLs and No-Nulls by creating an 'update Flag' port:


The input port here is LOOKUP_INPUT10 which comes from lookup transformation. The output port "update Flag" gets its value from a condition that is based on the input port:

IIF(ISNULL(LOOKUP_INPUT10),'I','U')

So here I am assigning "I" and "U" for either LOOKUP_INPUT is Null or No_Null. You can choose other symbols as you like. It doesn't have to "I" or "U".

In other words, if Lookup_Input is Null, that means the lookup condition: Source.Task_ID = Target.Task_ID, Source.Project_ID = Target.Project_ID, Source.EVENT_NUM = Target.EVENT_NUM are not satisfied. Meaning that this particular record exist in the source that are recently populated (based on last update date filter ), but not in the target. Therefore, this record is flagged with "I". If the lookup_Input is not Null, then flag it with "U".

Depending on the data and the environment that we are working, sometimes just looking at whether 1 column is Null or not may not be enough. If those cases occurs where you need to make sure all of the lookup inputs satisfy the conditions or not, you can concatenate them in the expression. Converting non-text datatype before concatenation is also possible. An example will be:


In the above situation, I bring all of the needed lookup input columns into expression, then in the update_flag expression, I have:
IIF(ISNULL(to_char(LOOKUP_INPUT10)||'~'||to_char(LOOKUP_INPUT11)||'~'||
LOOKUP_INPUT12||'~'||LOOKUP_INPUT13||'~'||TO_CHAR(LOOKUP_INPUT14)||'~'
||TO_CHAR(LOOKUP_INPUT15)),'I','U')

You can explore your own environment and find out what works for you.

Now bring update Flag along with all of the columns from the source into Update Strategy Transformation where we will actually tell the transformation what to do when loading to the target:


In the update strategy expression, enter:
IIF(UPDATE_FLAG = 'I',DD_INSERT,IIF(UPDATE_FLAG = 'U',DD_UPDATE,DD_REJECT))


Again here, we are associating "I" with DD_Insert, "U" with DD_Update, and everything else will be DD_Reject. These are the actual commands that Update strategy uses to interact with the target table.

Now that the mapping is built. Yet, because we are using parameters that the values are passing from DAC, therefore, in order for Informatica to receive these values, it needs to know what they are. For that reason, we have to add the mapping parameters in this specific mapping:


Here we are adding 6 parameters to the list, because they are what's used in this mapping:

$$LAST_EXTRACT_DATE --- Referred by the expression in $$LAST_UPDATE_FILTER
$$LAST_UPDATE_FILTER --- Used in Source Qualifier Transformation
$$LOOKUP_INPUT10 --- Lookup Override
$$LOOKUP_INPUT11 --- Lookup Override
$$LOOKUP_INPUT12 --- Lookup Override
$$TARGET_TABLE --- Lookup Override

So from this point, we are done with the mapping.

In the next entry, we will continue on with the configuring the tasks and workflow in Workflow Manager.

Until Next Time!


Wednesday, March 7, 2012

Configuring Incremental Loading In Oracle BI Apps Part 2

In the previous post, I briefly talked about how Incremental loading works and how to go about it at the high level. So, it's time to get to the details.

So let's start with an easy example that there is 1 source and 1 target, which is PA_EVENT table. This table has 3 unique columns "Task_ID", "PROJECT_ID" and "Event_Num".

Before we start with the mapping, let's make these 2 columns the primary key in target designer:

In Dac, make sure we have 2 global parameters, or source system parameters:

$$LAST_EXTRACT_DATE: This is a variable that the value is determined at run time. DAC_SOURCE_REFRESH_TIMESTAMP is the default run time variable that stores the history of timestamps of all the updates made in the source table in the database.


$$LAST_UPDATE_FILTER: This is a parameter that I have created for informatica to use in it's source filter. This parameter's value is static with the logic: LAST_UPDATE_DATE > TO_DATE('@DAC_$$LAST_EXTRACT_DATE','MM/DD/YYYY HH24:MI:SS')

In other words, when I enter this parameter in the source qualifier, at run time the above column will be added as a where clause in the sql statement, filtering out all of the records that the last_update_date is less than last_extract_date from the source level.


So now let's start implementing the incremental logic in Informatica.

As you can see, the beginning of the mapping is very simple and straight-forward. We are going from source to applying the filter in SQ transformation, now here we are.


So now, everything that comes before lookup transformation should be the records that it's corresponding last update date is greater than the previous recorded timestamp, not all of the records stored in the source table.

Therefore, from these filtered records, we need to see whether we are going to insert them in the target or update them if it already exist in the target.

How do we know what to do? Well, we will look at the three unique columns "TASK_ID", "PROJECT_ID"and "EVENT_NUM" and see if they match from both source and target. This is where lookup transformation comes into the picture:


From there as we can see, there are 6 columns in the lookup, 3 are from the source, the primary key columns. The other 3 are created to be the lookup columns, there I am calling them LOOKUP_INPUT10, 11 and 12. These columns in reality, will be referring to the target columns of the same. So I am really just going from source.Task_ID to target.Task_ID here. Although it may look fancy.

Now, we need to set the lookup conditions as how we want to compare these fields. We have the option of setting source.Task_ID equal target.Task_ID or great or less or whatever. This time, I am setting the condition to be equal:


Now at run time, informatica doesn't know what lookup_input10 is TASK_ID. The value is going to come from DAC which we will get to later. Therefore, we need to specifically tell Lookup transformation about these things, therefore, we define lookup override in the property:


What I entered there is:

SELECT
$$LOOKUP_INPUT10 AS LOOKUP_INPUT10,
$$LOOKUP_INPUT11 AS LOOKUP_INPUT11,
$$LOOKUP_INPUT12 AS LOOKUP_INPUT12
FROM
$$TARGET_TABLE --

Each of the "$$" represents a parameter name that we will later define in DAC. So this SQL will be executed at run time and the result of this statement will be used to compared to the 3 columns from the source based on the lookup conditions.

In our particular case, think of it like this:

Source: The filtered 3 unique columns from the source has a list of records that are recently updated after the last loading.

Target: Select 3 columns from the target table

Lookup condition: (if ) Source = Target

Then generates 1 lookup output that holds the result of each comparison and bring it into expression transformation for assigning meanings to the lookup output:


So we are good so far. We will continue on finishing the mapping in my next entry:

Until next time:


Tuesday, March 6, 2012

Configuring Incremental Loading In Oracle BI Apps Part 1

Hello

As we all know, BI Apps is a package of tools with out of the box configuration catered to specific business area. It consists of pre-build Informatica ETL mappings, Dac Tasks and OBIEE data models & dashboards.

More often than none, we have to customized these pre-build objects in order to have it fit in to our specific project environments. These customization includes adding new fields across the ETL, changing the data models, adding incremental logic to non-incremental mapping and so on. Today, let's talk about how to configure Incremental Loading logic in BI Apps environment.

There are many different ways to implement incremental loading in BI Apps environment, the way I am going to do is by passing parameters from DAC into Informatica for incremental loading. The logic of the mapping is more or less similar to the standard Informatica practice.

For beginners, let's break down the process as follow"

1. Determine how many columns of the target table are unique columns that should be primary keys.

2. Filtering the source based on certain columns to determine what data are new data and what are old data. Usually, for each type II or type III Slowly Changed Dimension tables, "last_update_date" is almost the best column to filter on in source qualifier transformation.

3. Use lookup transformation to compare the unique columns from source to target and provide 1 output.

4. The value of the lookup output is either null or not-null as the result of comparing the source and target field. If everything in the source already exist in the target, then the lookup outcome is (depending on the lookup condition) null or not.

5. In the expression transformation, create conditions for null or non-null scenarios by assigning values such as "I" or "U".

6. In the update strategy transformation, using DD_Insert, DD_update commends in update strategy expression for each of those values from expression transformation.

The next article, we will look up the detail steps from Informatica to DAC on how to actually implement the incremental load

Until next time!
Related Posts Plugin for WordPress, Blogger...