Disclaimer

All of the topics discussed here in this blog comes from my real life encounters. They serve as references for future research. All of the data, contents and information presented in my entries have been altered and edited to protect the confidentiality and privacy of the clients.

Various scenarios of designing RPD and data modeling

Find the easiest and most straightforward way of designing RPD and data models that are dynamic and robust

Countless examples of dashboard and report design cases

Making the dashboard truly interactive

The concept of Business Intelligence

The most important concept ever need to understand to implement any successful OBIEE projects

Making it easy for beginners and business users

The perfect place for beginners to learn and get educated with Oracle Business Intelligence

Wednesday, April 21, 2010

Calculating the variances between the column sections in Pivot table

In the below report, we have a very standard pivot view which separates time based measures by dates in columns, and then applies a subtotal at column section level. Now what if instead of doing totaling on the 2 dates' measure, I want to apply variance between the two as indicated below?
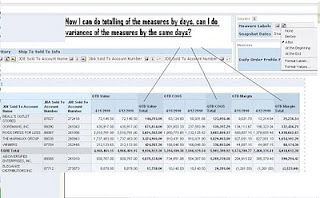


The main challenge here is that all the values for different dates are all coming from the same table columns, it only appears to be different physical columns in the pivot view. Hence, we can't simply define a math formula within the measure column itself.

There are several ways to do it, I will show you the easiest way to do it. There is no need to create new measure columns with formulas or what not.

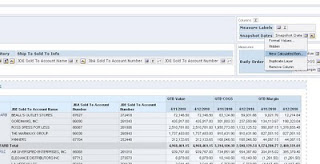
The first thing to do is clicking on the column 'snapshot date' under column section and click 'new calculated item':


Name this new item "Diff" in my case and now you can see the 2 date values on the right hand side for selection:
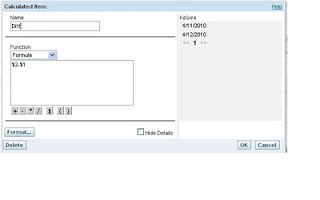

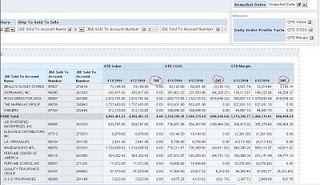
As you can see, I entered '$2-$1' in the formula instead of entering '4/12/2010 - 4/11/2010'. Both are going to take the measure values in snapshot column of 4/12/2010 and subtract from that of 4/11/2010. So just for the moment, both will produce the same result. However, by entering status date values in the calculated item formula will make the calculation status, therefore if the report changes it's snapshot date filter to be some other dates, we will have to go back to this item and check the date again. By entering '$2-$1' in the formula will allow this report to produce column variance dynamically. The '2' and '1' are the positions of the 2 columns so in this case, we are telling the server to use the second column (which is column 4/12/2010 at the moment) and subtract the first column (which is column 4/11/2010 at the moment). This will always give the right variance without having to manually change the formula:


Til next time.

Thursday, April 15, 2010

The fundamental understanding of Oracle Business Intelligence

There has been many times when during the interview I have asked or been asked the question "Could you explain to me what is OBIEE and what does it do?" This sounds like a really basic question that anybody can start with, which can also lead to so many different topics depending on the answers. I think this is worth blogging for specially after having had so many interviews or project related discussions with other professionals that have missed the point when speaking of OBIEE or even the topic of 'business intelligence' in general.

One of the most common response to the above question is that OBIEE is a reporting tool that can be used to create various reports and charts, Business Intelligence is the front end part of the data warehousing. I am not saying that this is the wrong answer at all. However, seeing OBIEE as just a reporting tool alone will make you miss the bigger picture. Certainly, from a pure technical perspective, OBIEE utilizes Kimball data modeling philosophy in its implementation design that enables users to view their business information, to analyze wide range of their business through the uses of reports, and various other views. It is typically the 'front end' of data warehouse process since most of the data & other objects that OBIEE deals with come from analytic database that is normally the receiving end of the ETL process sourcing from transactional database.

Indeed, as a pure technical OBIEE developer, the above could be mostly what they concern. However, the success of any BI project implementations start with the right understanding of OBIEE from a business perspective, only then the project can be set on a proper direction and expectations of the consumers can be effectively managed..

Therefore, following the response of "OBIEE being a reporting tool" comes my second question: "why would my company spend so much money to purchase this product if all we want is just to create some reports and charts?" Despite all the cool features of charting, pivoting, coloring of the reports that OBIEE provides, how would business get the biggest bang for their bucks by the purchase of this tool? Without knowing what OBIEE is really about, the project will likely go down the same path as before, only now each user is going to maintain 60 reports of 300K records each on OBIEE dashboard instead of on their excel spreadsheets like they did previously. I have seen or consulted on a few BI project implementations in the past where BI tool were used as a total duplication of what they were already doing and so we continued to customize our environment for the requirements that were fundamentally conflicting with the purpose of BI.

So what is OBIEE then? Well, in other to answer this question, we need to first ask ourselves this: what is business intelligence?

In my opinion, business intelligence is a realization of the concept of interacting with the complete inside world of one's business analytically, dynamically in order to gain thorough, accurate understanding of specific business areas for making better business decisions effectively and timely. Therefore, OBIEE is an application that implements the concept of business intelligence by the means of slicing & dicing huge volumes of data across numbers of data sources, and as a result, creates a platform of business information that enables users to adhoc query valuable information at will, view their information in a centralized and highly interactive platform that's easy for maintaining controls, and publish information that dynamically updates as business progresses.

In summary, implementing OBIEE in your business isn't just about having a new software tool, it is about adopting a new concept or a new business practice. Therefore, if all you want to do is having 30k records in several excel sheets to find whatever account that still owes certain amount of money since x number of years ago, then printing out tons of papers, then don't use OBIEE because the idea of OBIEE is to not have users to leave the dashboard or making users go through 65ooo records(the default max record setting) after downloading into excel, rather, it is about answering any specific business questions with spot-on answer. It's about making the mind of your business talk to you live.
Related Posts Plugin for WordPress, Blogger...