Disclaimer

All of the topics discussed here in this blog comes from my real life encounters. They serve as references for future research. All of the data, contents and information presented in my entries have been altered and edited to protect the confidentiality and privacy of the clients.

Various scenarios of designing RPD and data modeling

Find the easiest and most straightforward way of designing RPD and data models that are dynamic and robust

Countless examples of dashboard and report design cases

Making the dashboard truly interactive

The concept of Business Intelligence

The most important concept ever need to understand to implement any successful OBIEE projects

Making it easy for beginners and business users

The perfect place for beginners to learn and get educated with Oracle Business Intelligence

Friday, February 3, 2012

How to run stored procedure from DAC

Hello Again

It's been a while.. This time I want to share something I just learned over the past few months, it is how to execute a stored procedure directly in DAC without having anything to do with Informatica (as discussed in the previous post).

Let's say we have a store procedure or package 'mck_client_wip_load' in stance 'mck_build_revwip_pkg', or mck_build_revwip_pkg.mck_client_wip_load. In order to execute this stored procedure in directly DAC, we need to create 'action', in this case 'task action'. After all, we will execute DAC task to do the execution.

In the action task window, create a new task with a name. In my case I just use 'MCK_BUILD_REVWIP_PKG_MCK_CLIENT_WIP_LOAD'

Now we have to define the value of this action as show:


Now the most important part is to enter the commend for executing the Store Procedure in Action. The place to enter the commend is shown:


The code that I entered here is:
BEGIN
mck_build_revwip_pkg.mck_client_wip_load(@DAC_$$PARAMETER1),(@DAC_$$PARAMETER2),(@DAC_$$PARAMETER3);
END;

Notice that there are 3 parameters in this code. That is because this specific store procedure requires 3 input values at run time. If the store procedure doesn't need any input values, then it would simply have been:
BEGIN
mck_build_revwip_pkg.mck_client_wip_load;
END;

If you look at the left pane of the above image, you will notice that '@DAC_$$PARAMETER1' is available for you to click on under SQL Statement pane.

In order for this to happen, we need to create these parameters in task. So let's go there:


In the task, we enter the task action name 'MCK_BUILD_REVWIP_PKG_MCK_CLIENT_WIP_LOAD' in both commend for incremental load and full load field.

Then in 'Execution Type' field we select 'SQL file'.

The values for folder name and Primary Source and Primary Target aren't important in this case
as we are not dealing with informatica at all. The value for Primary Source should be the connection parameter for which database the store procedure is located.

Now, in the parameter tab under the Task, we create 3 parameters:


Each of the 3 parameters also have a hard coded value in this case.

This is pretty much it and the rest is simply adding this task in the subject area and execution plan for running it.

When running this execution plan, it is as if executing the following statement directly in the DB with the parameter values:

BEGIN
mck_build_revwip_pkg.mck_client_wip_load(@DAC_$$PARAMETER1),(@DAC_$$PARAMETER2),(@DAC_$$PARAMETER3);
END;

Until next time!

Thanks


Friday, December 2, 2011

Informatica Case Study: Execute stored procedure with dynamic input and generate error messages for reporting

Hello Again.

Today I am going to share a real case study where it is required to execute a stored procedure using Informatica and stores the output of any potential errors.

We have written a stored procedure that will invoke reports from the main frame machine based on inputs, and as a result, a report in the form of PDF will be created. The input for the store procedure will be the report name, which varies. The output, if report name is valid, will be PDF reports that the store procedure invokes, if on the other hand when the report name is not valid anymore, there will be error messages invoked by the store procedure. These error messages along with the date and time will be stored in an database table for reporting purpose.

So having gathered this requirement, how are we going to implement this ETL process in Informatica?

I have decided to create an informatica mapping with stored procedure transformation and use mapping parameters to past report names as inputs to stored procedure transformation. How would the mapping parameters capture the report name values? That is what we will do in DAC which we will get to later.

So let's start with this mapping that I already built:


For the image, I have indicated different parts of the mapping as what they are for. So let's first create a mapping parameter and call it $$ReportNameVar:


In the expression transformation, i have used $$ReportNameVar as an output. In addition, I used the build-in parameter Sys_Date for 'Date' output port and connect it directly to the target table's Sysdate port. The Report Name port is connected to the store procedure transformation to provide its input, it is also connected to the target table's Report Name port to provide the list of report names. Now as I said, the expression for 'Report Name' port in expression transformation is $$ReportNameVar, which is the parameter I just created. We will later work with this in DAC to have it populated with the value we want.


The stored procedure transformation is pretty straight-forward in its configuration, we simply import the store procedure and create the transformation. There are 2 ports upon importing the store procedure: Return_Value as output and return port, P_Report_Name as input port. In the property tab, we can see the name of the store procedure is 'Invoke report':


Now, connect the 'Return_Value' port of the store procedure transformation to 'error_message' port of the target. Connect 'Nextval' from sequence generator to 'Row_ID' of target. Leave 'Error status' unconnected for now, we are all set for the mapping.

I will skip the part on how to create the workflow for this mapping because it is very straightforward. Lets just say that the workflow is MCK_ReportName_SP. Get done and move into DAC.

This is what needs to be done in DAC for this to work:

1. We need to create as many tasks as there is for report names. In our case, we have 7 different reports, so seven tasks needed.

2. In each task, the workflow that it associates to will be the same as 'MCK_ReportName_SP'. But in each task, we create a different parameter value.

3. Group all these tasks in a task group if we are going to index the target table. If not, run them all together in one execution plan.

4. Create a parameter file and save it on the informatica server for DAC to communicate with informatica on passing the values created in step 2.

So first thing first:

All 7 tasks created with the same value for full load commend as 'MCK_ReportName_SP'


Now in the 'parameter' tab under each tasks, we can create parameter and assign values to it. The name of the parameter will be the same as we defined in informatica, and the value will be hardcoded as the report name. Each task will have its own value. In fact, I have made it easier for myself by naming each task with report name as ending:


This is pretty much the configuration. Everything else after that is just straightforward as we group all these 7 tasks in one subject area and create execution plan to run it. If you have trouble understanding how to do it, please read my other articles here.

Don't forget to create parameter files in notepad and save it on the server. In this case, my parameter file is very simple, it only has the following:

[SDE_MCK_Forklift.WF:MCK_ReportName_SP.ST:MCK_ReportName_SP]

$$ReportNameVar = MCKARSV1

SDE_MCK_Forklift is the folder where workflow is saved under in informatica's workflow manager. Then the name of the workflow name and session name are both MCK_ReportName_SP

Now upon running this execution plan, this is what the behavior looks like:


In other words, the same workflow in Informatica will be repeatedly running 7 times one after another's success, because there are 7 tasks all pointing at the same workflow. The only difference is that in the session log of each run, you will see different parameter values being used.


Now let's quickly check the target table 'Report_Status' and see what has been loaded in there:


As we can see, different report name has been loaded with different error messages. The report name column is basically the mapping parameter $$ReportNameVar defined in expression transformation, so this shows that the DAC parameter value has been successfully passed into informatica and loaded into the target..

Error_Message column is using the output 'return_value' of the stored procedure transformation as the source. This shows that the output of the store procedure as been loaded into the target table with different error message defined withe store procedure itself..

So the bottom line is that using parameters defined in DAC, we can pass the value into informatica for running the store procedure. This way of doing is flexible, however, if we are getting more and more reports, then this approach will make you end up with a lot of tasks. If when report name list starts getting longer and longer, we will consider storing these report names in a external table and using that as an input for the store procedure. I digress.

Until next time

Thanks!


Wednesday, October 26, 2011

OBIEE11G: Basic Navigation On Presentation Service Interface


Hello

Last time I briefly went over some of the obvious difference between OBIEE 1OG and 11G in terms of working with the rpd using Admin Tool. This time let's take a general overview on what the front end presentation service looks like in 11G compare to what it used to be like in 10G.

For those who have quite a lot of experience with 10G but haven't had hands-on experience working with 11G, I hope this article will help you better relate the things you are already familiar in 10G to how it is now in 11G.

For the most parts, things aren't that different in 11G despite what it seems. However, there are many new features added in 11G and also there are changes being done. Whether we like it or not, it will take some getting used to. There are some changes in 11G that I don't quite like, but again, there is nothing we can do about but to get used to it. So let's start by taking a look at the initial UI upon logging in:


You see, I have divided the UI into 5 sections, each one is labelled with a letter. We will go over what each section does.

Section A: This section is named 'Create'. If you look closely, you will see a list of things underneath such as Analysis and Dashboard, Published Reporting, Actionable Intelligence, Performance Management and Marketing.

If you are familiar with 10G, you will know that in 11G they are calling 10G reports as 'Analysis' meanwhile BI Publisher Reports are called 'reports', Ibots are now 'Agents'. So this section is nothing but the place where you would start creating new objects. 11G allows us to create scorecards as a performance management measure, if you want to know how to do so, there is a good article out there that gives excellent details, you can find it here.

Section B: Although visually this section is the largest, it is nothing more than a display of what objects that have already been created and visited. In other words, this is the place for users to directly go back to the reports and analysis that they have recently created and visited.

Section C: Browse/Manage is where you can go in to search for the objects you want. It could be reports, analysis, scorecards, filters and so on. This is the closest to manage catalog that we used to do in 10G.

Section D: This is called 'get started' section. This is where you can find some of the documents with regard to 11G. So in other words, this is more of a resource place, we don't need it for any actual work in 11G.

Section E: This section is highlighted in Blue and labelled 'E' in red. This is the tool bar on upper right side of the UI screen. This section provides an easy and quick access to some of the places that Section A,B,C would take you too.

For Instance: clicking 'Catalog', it will take you to a list of objects under the webcatalog, similar to what Section C would take you too. Clicking 'Dashboards' will give you access to a list of dashboards that exist out there. Clicking 'New' allows you to create any new objects similar to Section A's functionality, clicking 'Open' is the same as what Section B is doing.

Now remember in 10G there is a place where we can do a list of administrative tasks such as monitoring queries, managing a list of object level security and so on? Here in 11G, this is accessed through 'Administration' in Section E. It will take you the similar UI that we are familiar with in 10G:


So now that you know where things are, let's move on from here. In 10G, we are so used to seeing a list of subject areas on the right pane and a list of saved reports and folders on the right side upon log in, but here it is different visually. So how do we get to the list of subject areas and start working?

Simple, just click on 'Analysis' either in Section A, or on the drop-down list under 'New' in Section E, then you will see a list of Subject areas like so:

Let's say I click on 'Financial - AP Transaction' subject area, it then takes us to the place where we are familiar with in 10G (well, maybe not the background color):


Notice a bottom that I have indicated in the screenshot? This is a new feature that allows us to add more subject areas on to our query list. So unlike in 10G, we are not limited to creating reports out of only 1 subject areas anymore. Pretty cool, isn't it?

Let's move on to checking out the dashboards by clicking 'Dashboard' in Section E and just pick one in the list:


Then we go to the dashboard page. Of course, you always see a bunch of errors in my dashboards :(

But guess what, it is still the same way as in 10G on how to access the dasboard content page via 'Edit Dashboard'


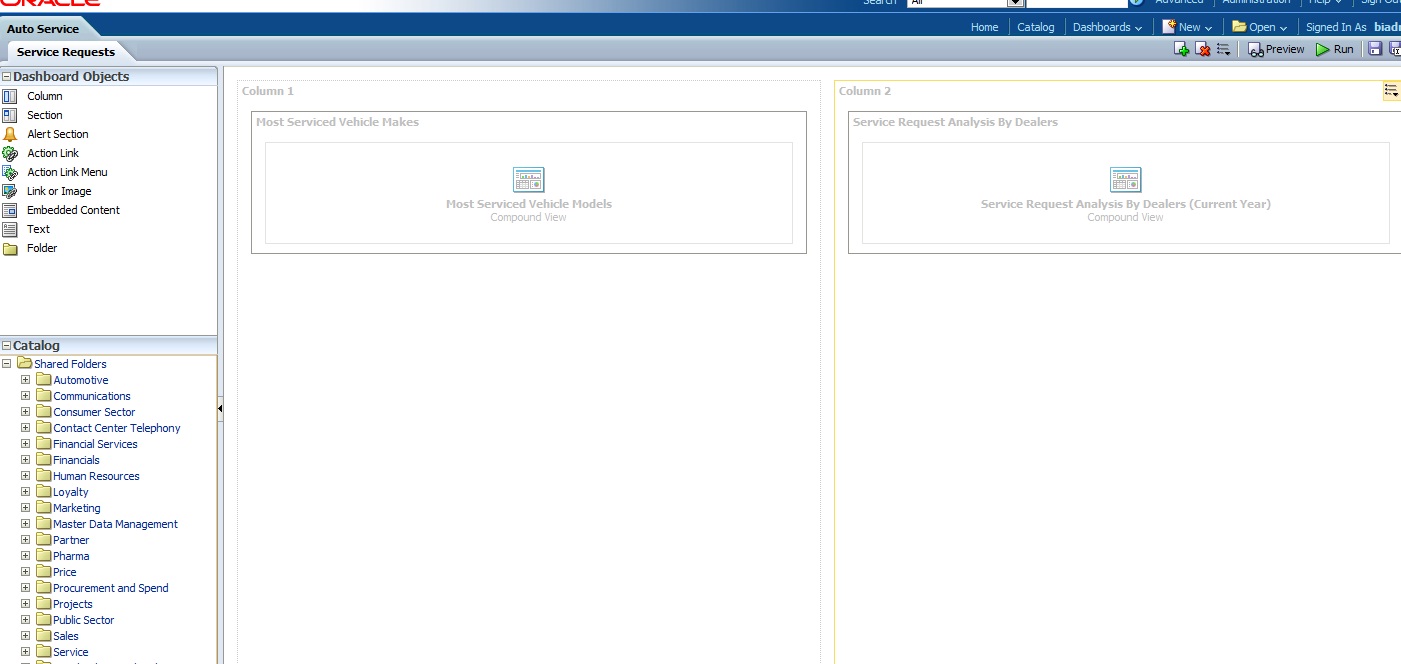
And here we are:


So, not bad at all. Although there are different dashboard objects that allows you to do different things with the dashboard, but most of the processes are still the same. So if you are familiar with how to create dashboards, it isn't so different here either..

So let's stop here then... My purpose is to help you take the element of fear of uncertainty out of the equation. I hope that now you see 11G isn't that different from 10G fundamentally, it should make your learning and getting used to much easier.

Go and play with it, let me know what are your likes and dislikes.

Until next time


Thursday, October 6, 2011

R.I.P Steve Jobs

I have never owned any of Steve's products. I always wanted to but i always came up with excuses to delay my purchase. Now that he is gone, it made me feel sad. Life goes fast and before i realized how many excuses I have made to myself not to do it, it is too late. RIP Mr Jobs... I am still using my old phone, old computer. The next product that I get will guarantee to be one of your greatest creation!

Wednesday, October 5, 2011

OBIEE 1O1: An Absolute Beginner's Guide to shortcut the learning


Hello there again!

I have been getting a lot of feedback recently from people who are new to OBIEE. One of the most common thing that I am getting is that there are too much information out there for OBIEE and it is too difficult to make sense if you have no OBIEE hands-on experience prior. This is very true. The Internet is a great place to find knowledge and resource for whatever you want, but the amount of information you can find online can be overwhelming if you don't have any Insight experience of what you are learning, it is a place where people can get lost.

If you look at the subject of OBIEE, you know there is a lot for you to read. There is the Admin guide, user guide, installation guide and all kinds of other guides. Each talks about a different subject, sometimes they seem to be all related but more often they are not. If you haven't used the tools, haven't seen it, you will get lost just by reading these documents. Or it will take lots of time and hard work to get the knowledge. Therefore, I am trying to come up with an easier way for beginners to shortcut through the obstacles they might be facing in their learning. I am not saying not to read Oracle's document, but I am hoping that this article will help you make your understanding of those documents better and more effortlessly. This is an '101' for OBIEE, if you already know your way around the tool, you can still enjoy this article as it might give you a different perspective.

Anyways, my belief in doing what we do in life has to do with 3 aspects: What to do, how to do and why to do. For any people successful at what they do, they usually let 'why to do' to be the guide, which drives the rest of their actions. The same thing applies in understanding OBIEE. If you want to shortcut your learning curve, the best place to start with is to understand 'why we need OBIEE' or 'What is OBIEE trying to achieve?' To know the Why, you can read it here.

Let me just briefly explain what OBIEE is trying to achieve as an output from a technical perspective. You see, the predecessor of OBIEE is Siebel Analytic or NQuire even before. It was basically a tool that generates a SQL query to send to the relational Database and posts the query result at the UI where users can see it. OBIEE has taken this tool and added more features to it to do the job better and more flexibly. However, it doesn't change the fundamental of this application. Therefore, when you think of OBIEE, always remember that the output of your design and configuration is to produce an SQL Select statement, and the result of this output is the reports that you can publish on dashboard.

So having the above understanding, lets go look at 'how' OBIEE does it. Of course, as I am writing this article, I am assuming most of my readers have SQL knowledge and understands data modeling concepts. If you don't, then make this your first 'Why' to handle before you even think about learning OBIEE. Enough said here.

In order to produce the SQL select statement that meets the requirement, you have to know what you are selecting; from what tables or objects you are selecting from; where are the filtering conditions or joining conditions that applies to this statement. This is the basic elements that any select statements must have if selecting from multiple tables. Therefore, the way OBIEE does it is to use an application called 'Admin tool'. --- Now you can go read Oracle's Admin tool guide already knowing what it is here for, it will make your learning a lot more solid.

Anyways. the Admin tool upon entering looks like this (with explanation of each of the 3 layers):


If your client has purchased the OBIEE's pre-built model, such as BI Apps, Admin tool will look at the following upon login:


Now, you can go back to Oracle's Admin guide and read more about what you can do in each of the 3 layers in your design process.

For best practices, try to keep standard star-schema in your design. If you want to know more about the difference between joins in physical layer VS joins in BMM Layer, read this.

So, now that the design is finished as we have done our things from physical layer to BMM layer and rename the fields in business terms in presentation layer, we can save everything we have done in Admin tool. So all of the objects that we have saved are stored as an 'rpd' or repository. So if you ever come across the term Rpd file in any of the documents you read, you will know what they are talking about. Repository is a filed with '.rpd' at the end, it is saved in OBIEE's directory under 'repository folder'. The essence of 'production migration' is nothing but to copy the .rpd file from your design environment to the same folder within OBIEE directory on production environment. The 'how to do it' varies from company to company, but if you know the 'why', you can easily pick up the 'how'.

So moving on, we have done our design of data modeling, the next step is to create reports based on the design we have done in Admin Tool. This takes us to a different place: presentation service. Ok, in OBIEE 10g, we have one server (BI server) that controls the operation and connection between repository and the DB, and another server (presentation server and OC4J) that controls the operation of the UI of presentation service. 11G has changed the architecture by introducing weblogic. You can read more about the architecture of 10G vs 11G, Oracle has a few good documents and internet has some great articles about it too. I will skip that in this article.

Just to make it easier for beginners to understand, the way to get into the presentation service is by using a 'url link'. Every client has a different link, it is usually provided upon installation. Depending on the name of the server where OBIEE is installed, the url is different. For beginners, don't worry about those things. Just access the link that's provided by your admin and log on!

Of course the UI interface of 11g and 10 are very different. But it still work the same way. What you will see is a list of 'Subject Areas', which is the presentation folders you have designed in presentation layer. By clicking on the subject area, it takes you to a list of folders and columns that's within the subject area. All these are the exact same thing as your design in presentation layer. These are the objects users and report developers use to create their reports.

So upon knowing what it is and why we use presentation service/dashboard, go and read the Presentation service user guide for more details on how to create reports, how to use filters and prompts, how to customize fields and how to make reports and dashboard interactive.

This is good for now.. I hope this article gives you a good focus on where to start and where to follow at the beginning of your OBIEE learning journey. If you understands the BI concept and every thing that this article mentions, I will say you have built a pretty solid foundation. Of course, the best thing to do in order to get better is by practicing. Try it out in your testing environment, build some simple data schema and create some reports. Have fun with it.. Go back and ask yourself what if you want to see certain fancy stuffs, what if there is strange scenarios? What would you do? Use your imagination and creativity and keep exploring the answers!

Good luck!

Until next time
Related Posts Plugin for WordPress, Blogger...